- Conscious Supply Chain
- Posts
- Forecasting: Learning from Competitions: Issue 06
Forecasting: Learning from Competitions: Issue 06
What can one of the largest retail forecasting competition teach us?
Leon Hergert
July 06, 2025
“Let me do a moving average on the data to get a baseline”
OK - think about it, why did you do a moving average? What made you think this is the best method?
From my experience - it is usually either a (1) knowledge or (2) technical limitation problem.
So to recap again, why do we need different forecasting methods?
Because demand behaves very differently across SKUs: Some series are smooth and seasonal while others are sparse or erratic, no single algorithm can capture every pattern well.
What can we learn from one of the largest forecasting competitions?
M5 - Accuracy competition on a Walmart Retail data set:
Blend a few smart models, beat the classic forecast.
By simply averaging six variations of one machine-learning model (LGBM), the M5 champion cut forecast error by 22 % compared with the best old-school exponential-smoothing approach (which is still WAY better than a mov avg.).
Cross-learning scales accuracy. Training global models across >40k related series instead of one model per SKU let winners exploit patterns shared between stores, categories and states.
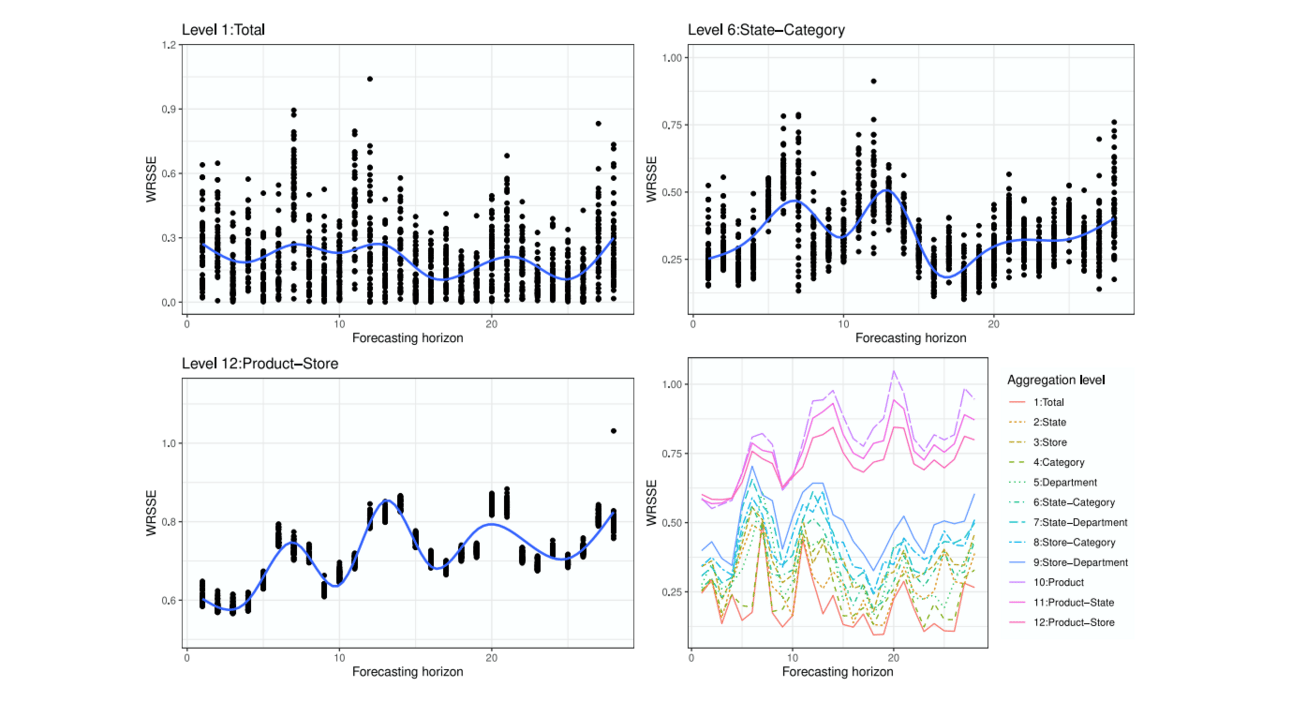
As you drill down, noise multiplies. Each step down the hierarchy adds variance, making fine-grained forecasts harder. Smart teams set different error targets, model mixes, and safety-stock rules for each tier instead of chasing a one-number standard.

Forecast error varies by aggregation level
Reminder: How do we validate the best method?
Take your historical sales data and hide the most-recent monthly block.
Train each candidate model on the earlier history, have it forecast those hidden days, and score the error with a specific metric (MAE, MAPE, …).
Walk the window back and repeat this “train-then-test” cycle multiple times.
The method that wins those rolling checks is the one you move into production.
This is called cross-validation - one of the most important aspects to forecast ‘the right way’.
How can I get the best method possible for my data?
Well, you usually have three options.
Note: I am deliberately not mentioning ERP submodules. They are much worse than using excel. If you’re going down that path to “plan demand” - I can only recommend to rethink this decision.
So it boils down to: Using your spreadsheet, build it yourself (e.g. with Python) or using a special software for demand & supply planning:
Stay in Excel
• Time to value: Instant
• Tech overhead: None
• What you get: Familiar UI
• Hidden costs: No cross-validation, no ML, version chaos, breaks at scale
Build in Python
• Time to value: 6-12 months
• Tech overhead: High (data engineers, MLOps)
• What you get: Unlimited modeling with forecasting library
• Hidden costs: Infra, deployment, ERP/WMS integration, maintenance
Software like Spherecast
• Time to value: <14 days
• Tech overhead: Low (SaaS)
• What you get: Multi-model engine, auto cross-validation, API connectors
• Hidden costs: Less DIY control, initial algorithm customization is managed for you
I recommend: Try your spreadsheet and feel the limitations for yourself. Sooner or later the realization will come that - for a professional supply chain org - these are not enough.
If there is one takeaway today: Start using modern forecasting techniques!
-Leon